
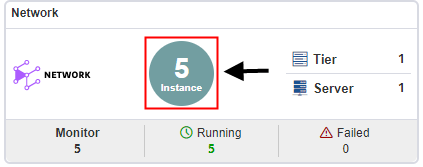
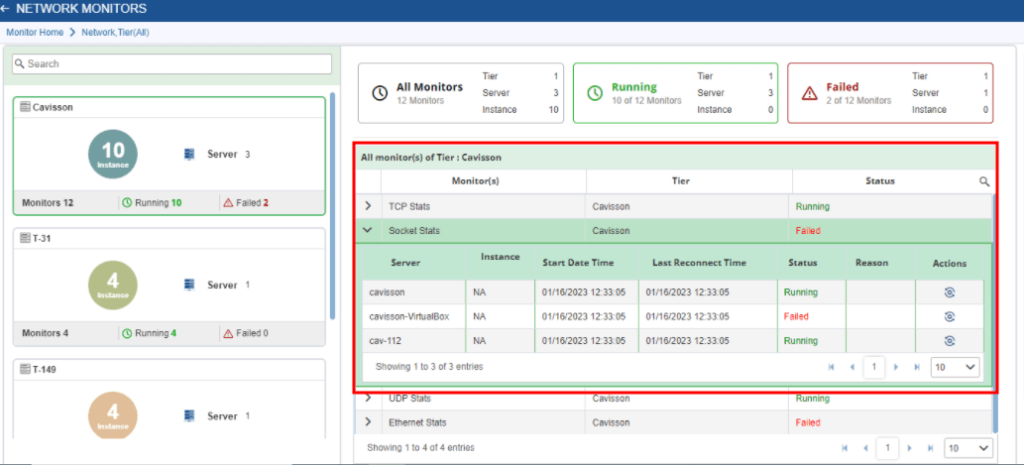
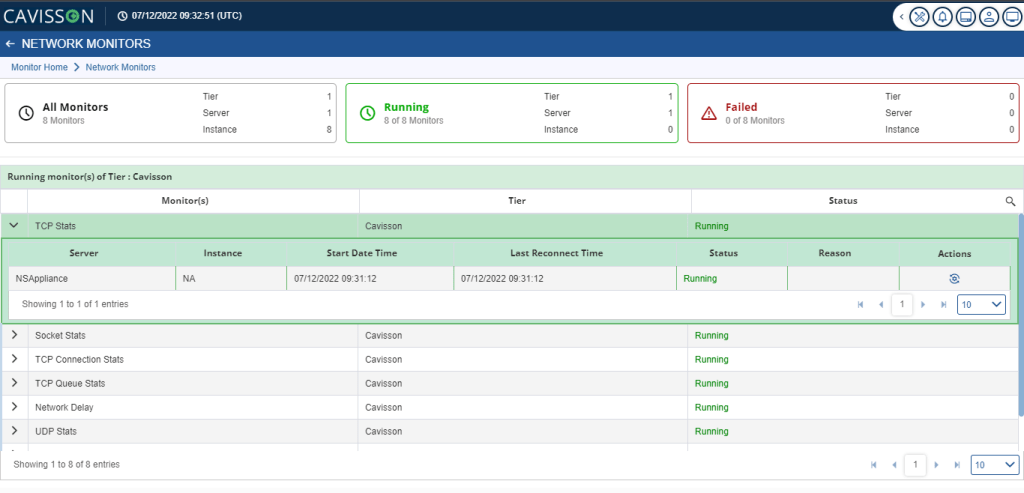
The following columns appear when we click the icon:
- Server: Shows the server name of that monitor.
- Instance: It is the user-defined name in the Tier > Server hierarchy.
- Start Date Time: Shows the start date and time of the server.
- Last Reconnect Time: Last time when the server was reconnected.
- Status: Shows the status of the server- Running or failed.
- Reason: The reason if any for the failure.
- Actions: Shows the actions which can be taken for the server.
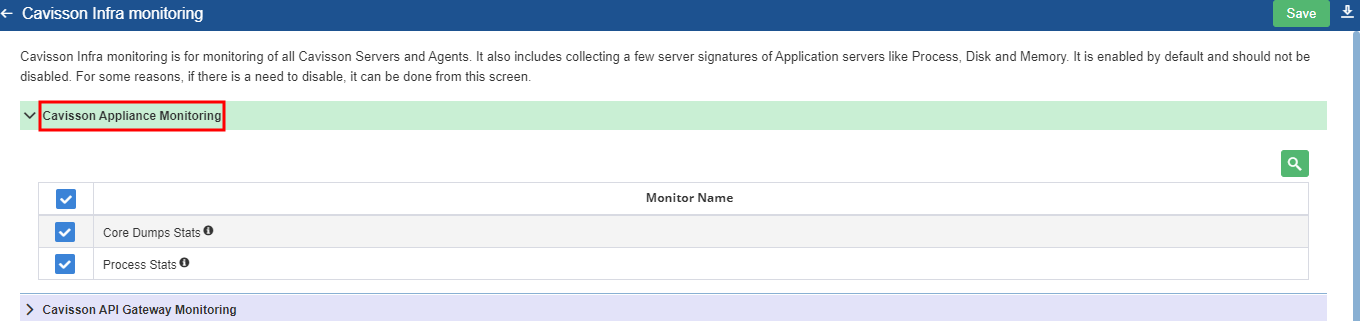
Cavisson Infra Monitoring
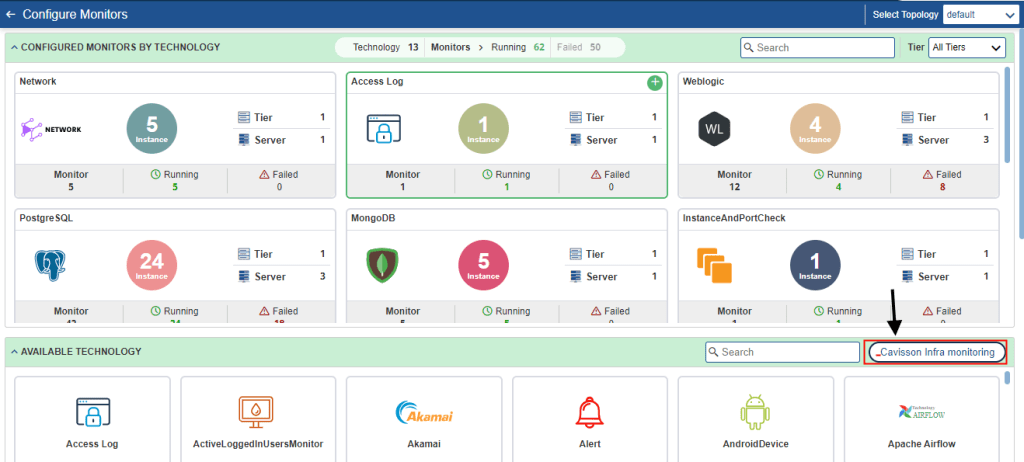
Cavisson Infra monitoring is for monitoring of all Cavisson Servers and Agents. It also includes collecting a few server signatures of Application servers like Process, Disk, and Memory. It is enabled by default and should not be disabled. To access this, click on the icon ![]() as shown in figure below.
as shown in figure below.
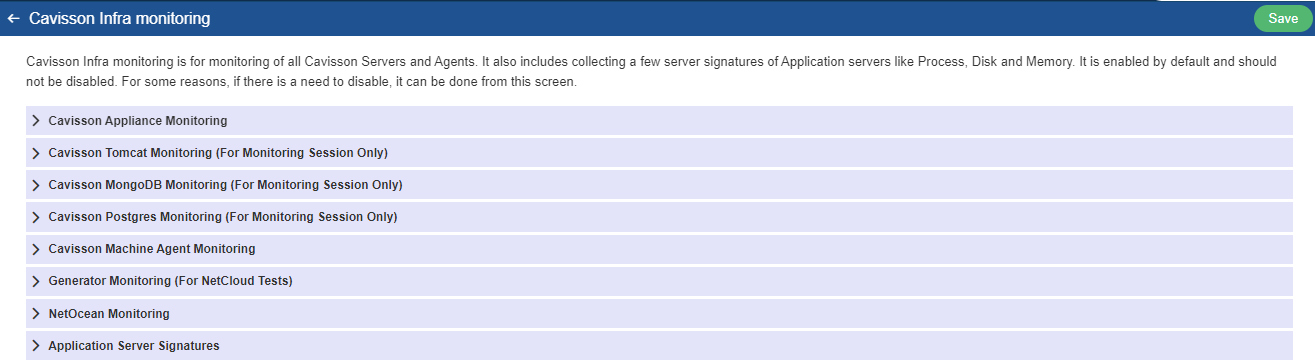
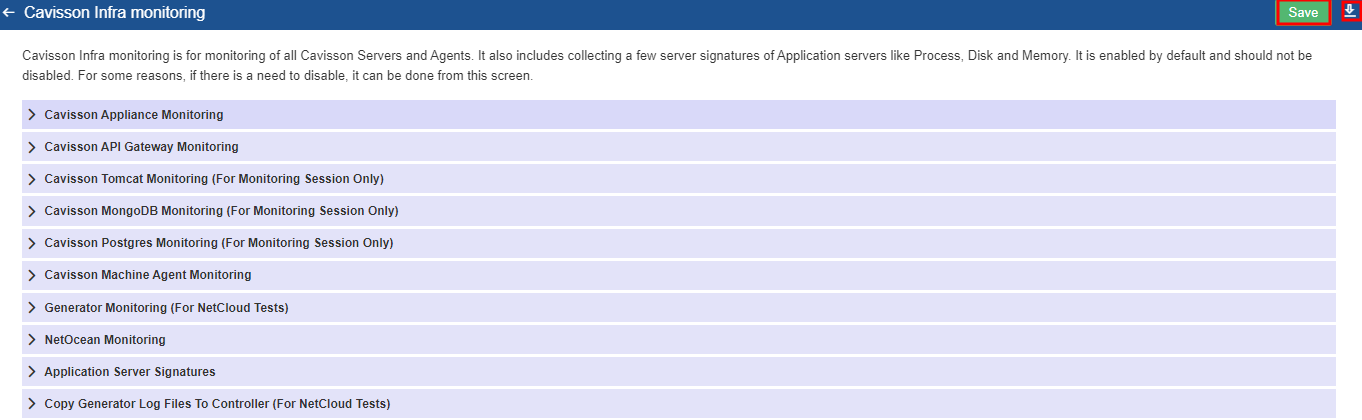
Click the Save button to save the settings in Infra monitoring. You can also download the infra-monitoring settings by clicking the ![]() icon.
icon.
If you expand any of the infra monitoring by clicking the ![]() icon, it will show the already configured monitors.
icon, it will show the already configured monitors.
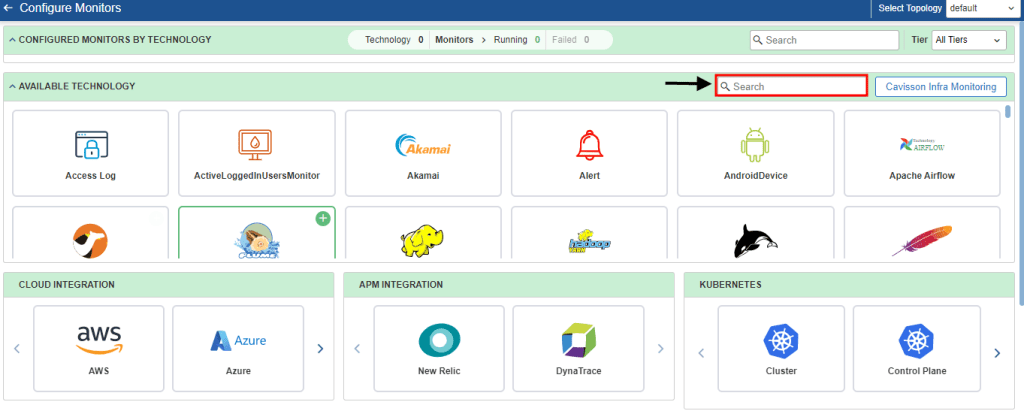
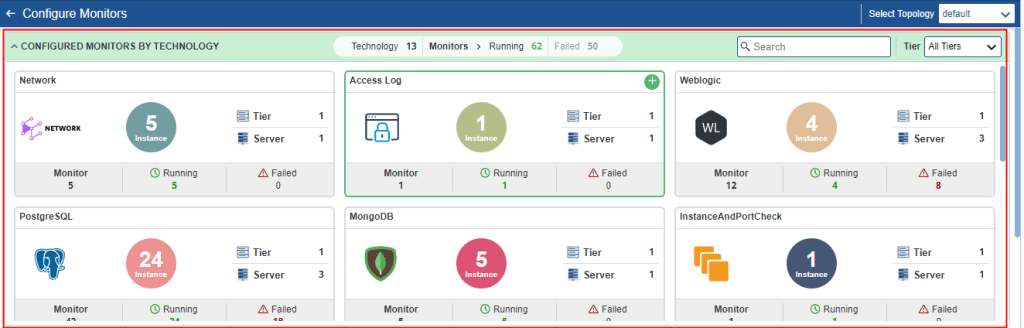
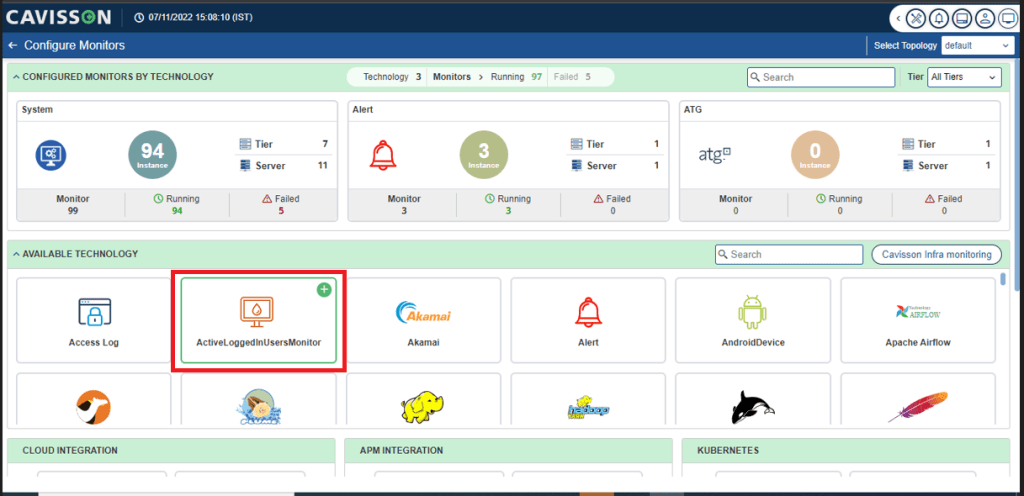
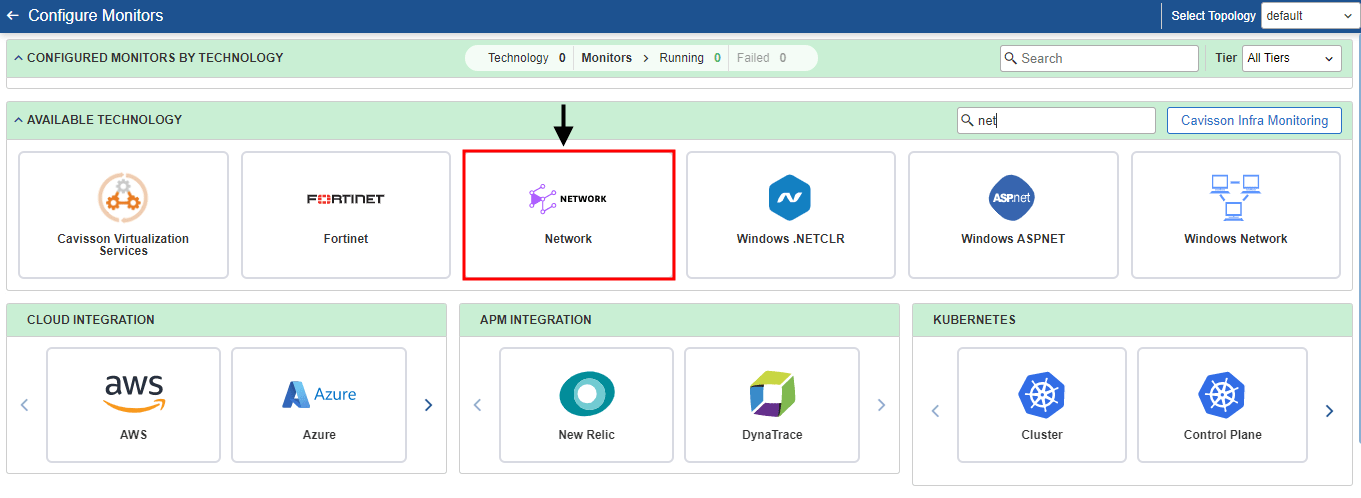
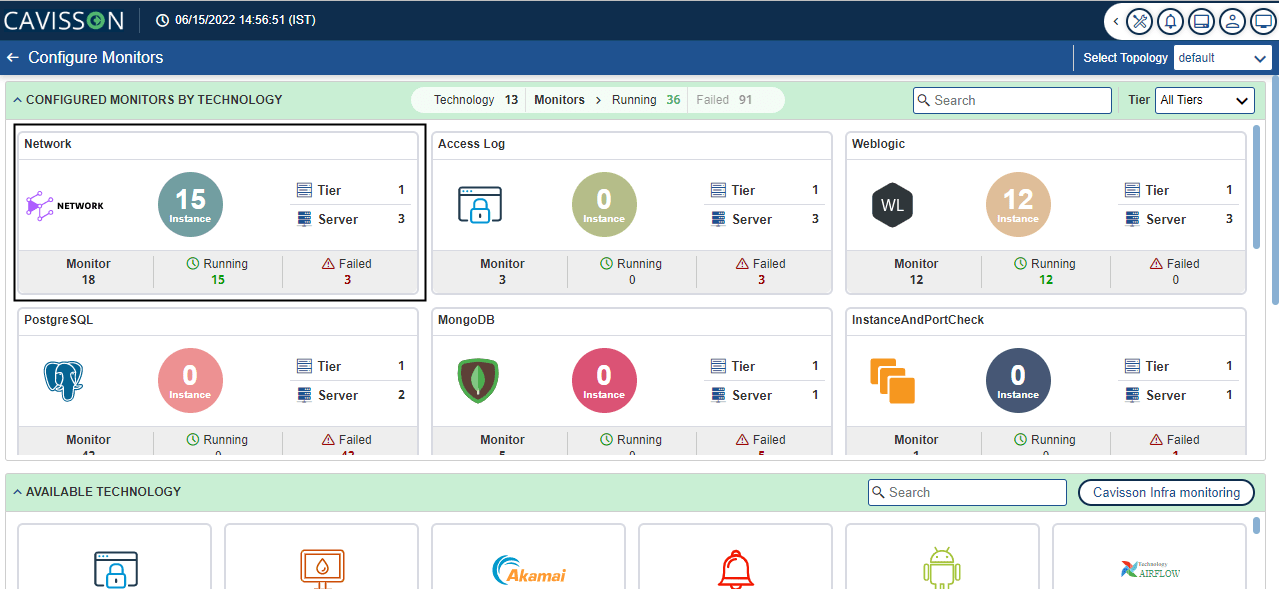
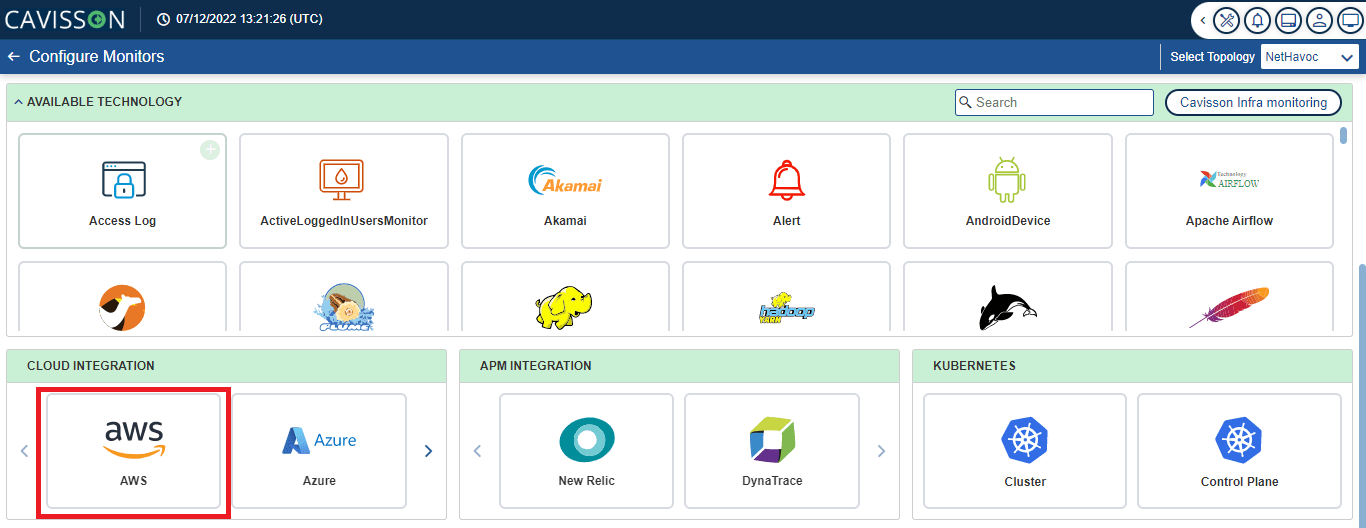
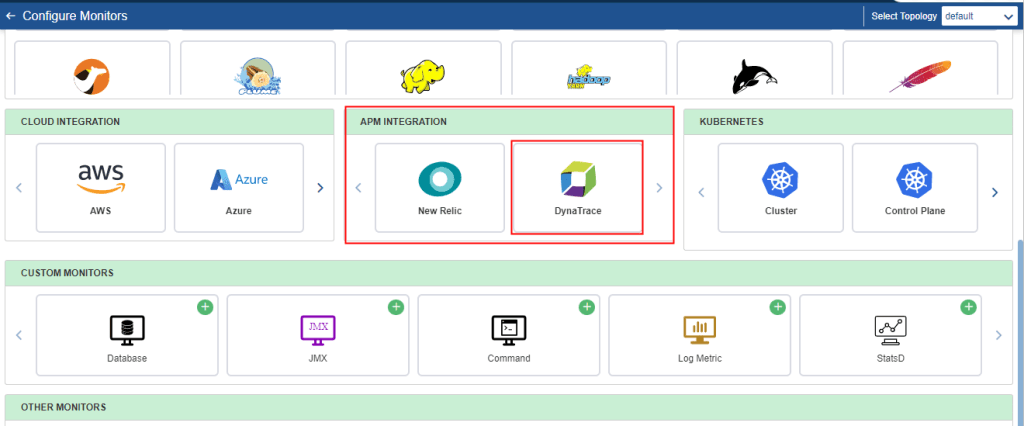
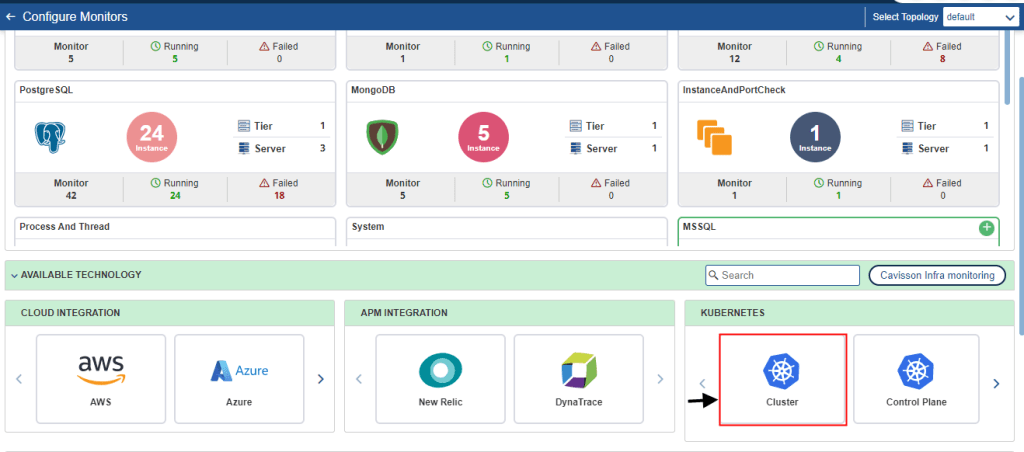
Available Technology
Available technology shows all the technology available. If you want to add a new technology for configuration, you need to click the add button in the top right corner of a particular technology.
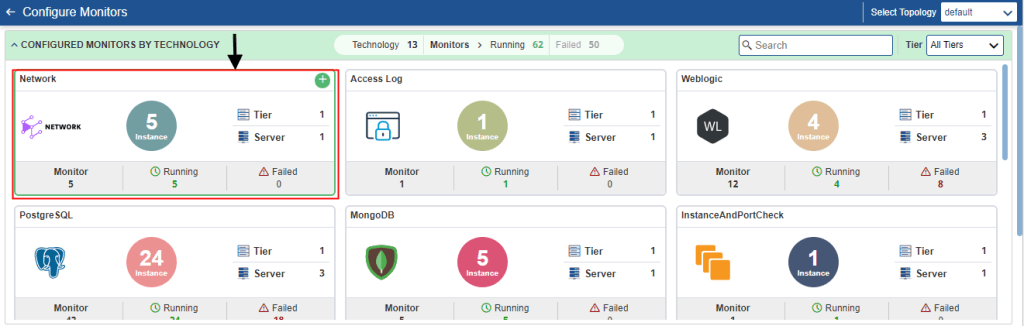
Add New Technologies
When a user needs to add new a technology or monitor, then they have to click on the ![]() ADD button of the desired technologies like: Network, Access Log, Alert, Window Based Monitors, etc.
ADD button of the desired technologies like: Network, Access Log, Alert, Window Based Monitors, etc.
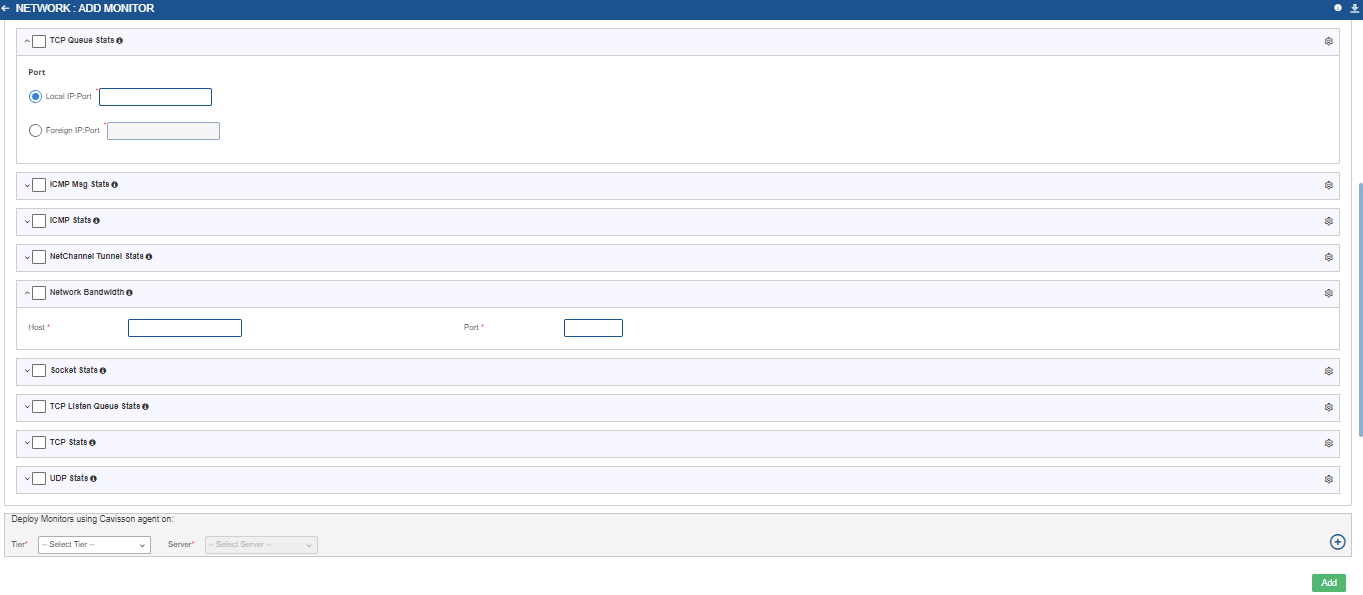
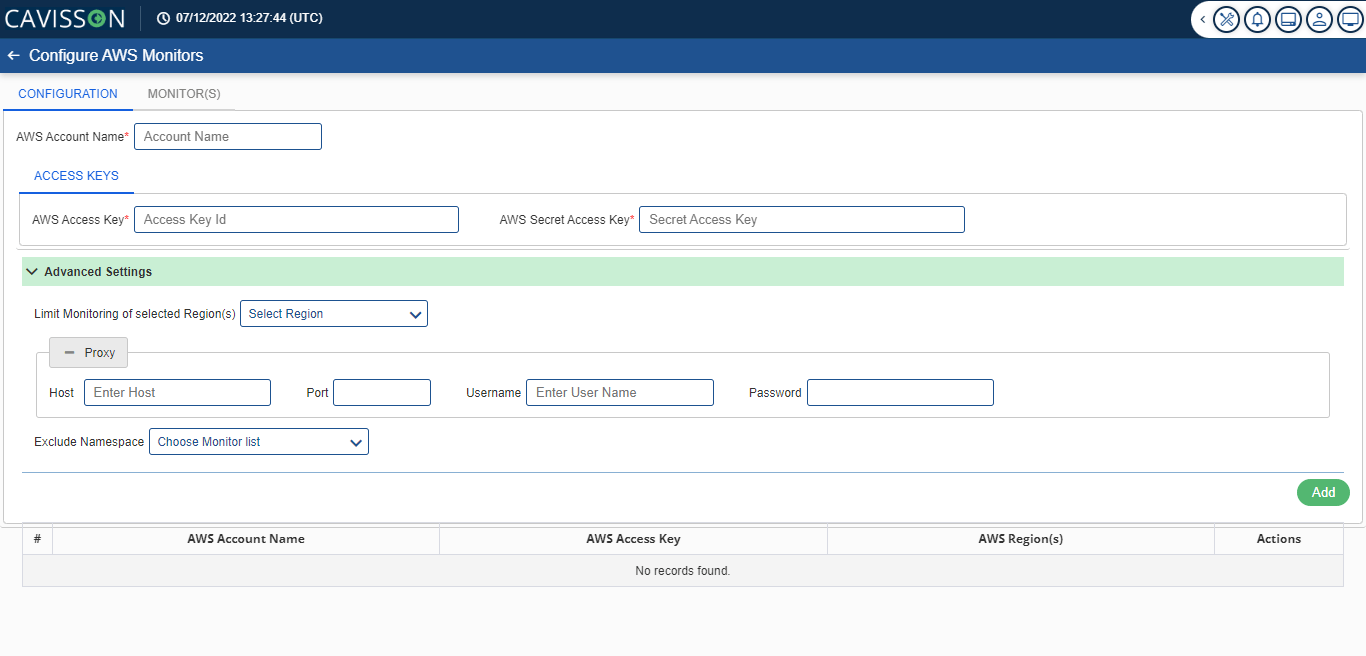
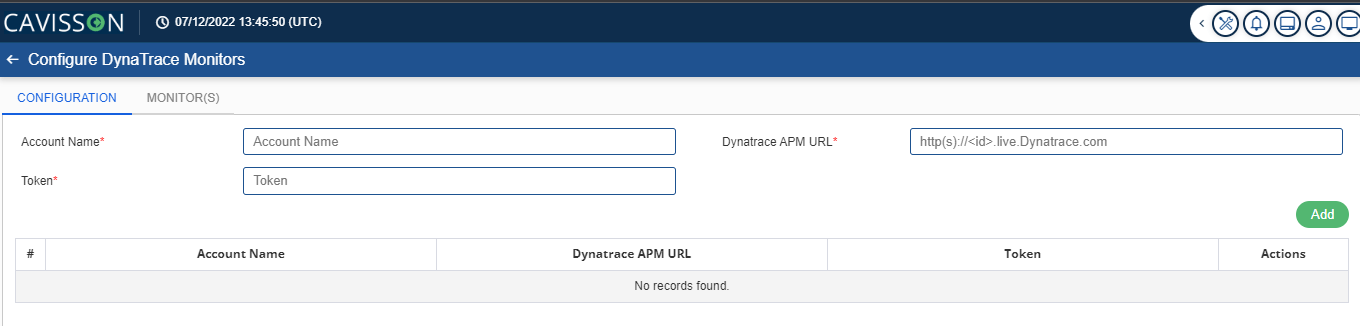
Notes:
- If a user wants to configure a monitor, they can refer to the Help Section
 by clicking on the Help Icon provided on the screen. User can also download the JSON of the configuration by clicking on the Download
  button.
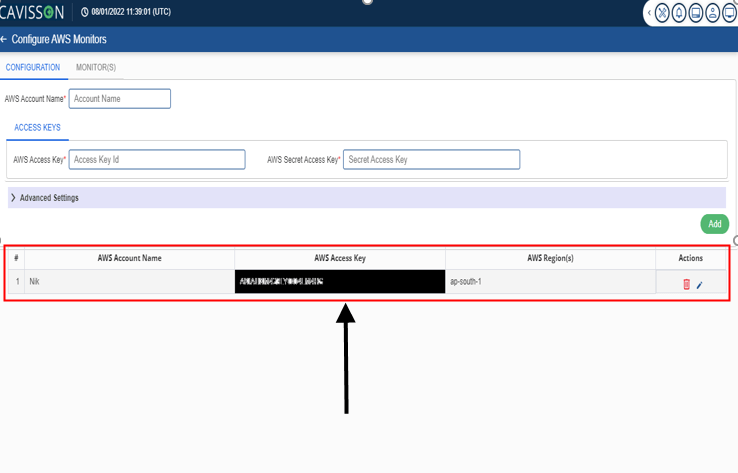
 - Once the user has filled all the fields, the user has to click on the Add
 button to add the details. Upon adding the details, it will show in the below table which contains the following information:
- Tier Server Information: It will show on which tier and server the monitor is being configured.
- Monitors: It will show the type of monitors which are being configured by the user.
- Actions: In actions, the user can either perform edit or delete operations. To edit the table, the user has to click on the Edit To
 delete a table, the user has to click on the Delete
  icon.
icon.
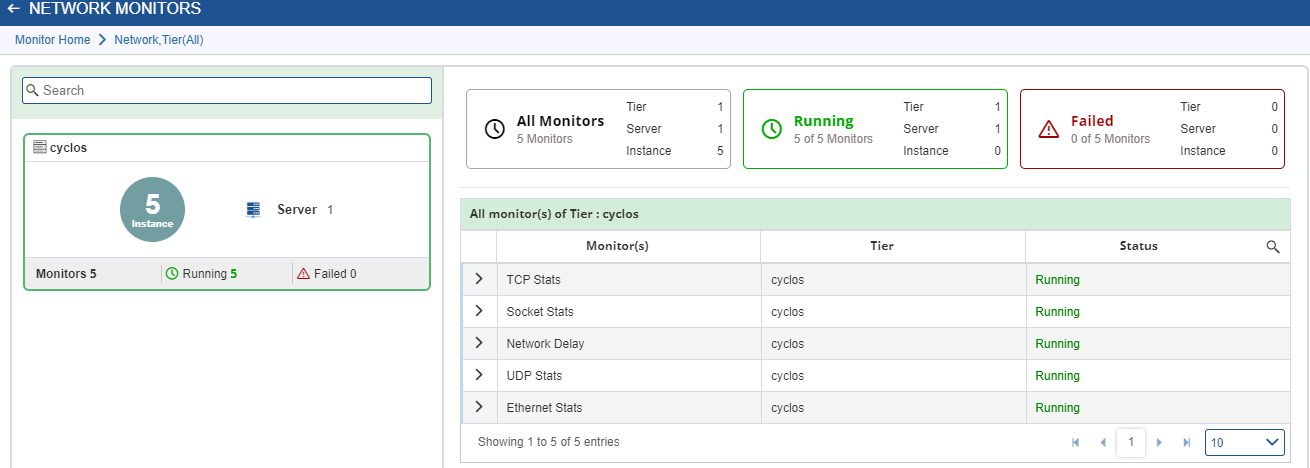
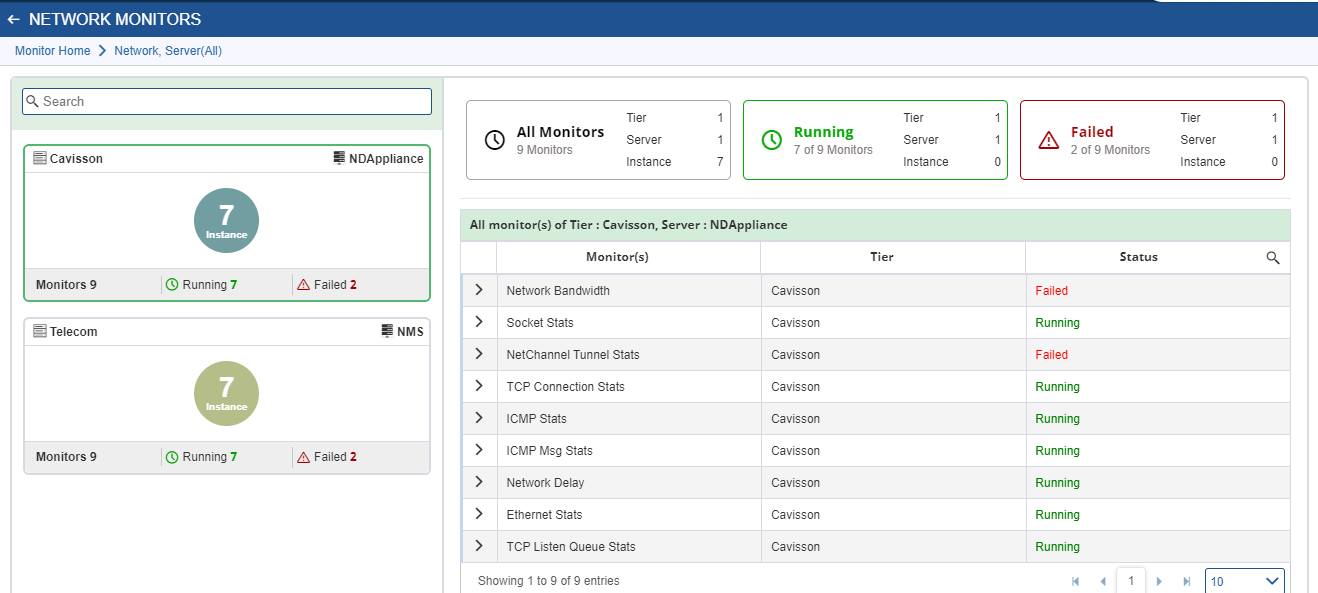
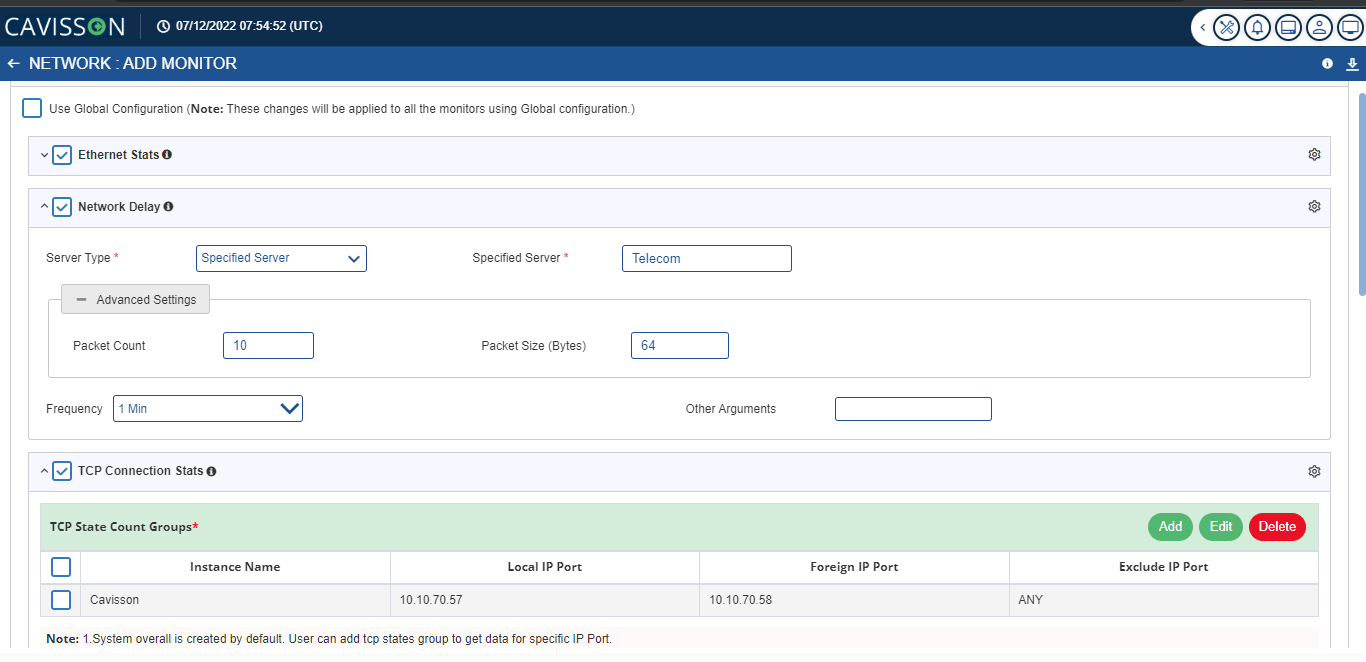
After adding the monitor, then it will redirect the user to the configured monitor UI and the user will be able to see the configured monitor.
Notes:
- If a user wants to configure a monitor, they can refer to the Help Section by clicking on the Help Icon provided on the screen. User can also download the JSON of the configuration by clicking on the Download
- Once the user has filled all the fields, the user has to click on the Add button to add the details. Upon adding the details, it will show in the below table which contains the following information:
- Tier Server Information: It will show on which tier and server the monitor is being configured.
- Monitors: It will show the type of monitors which are being configured by the user.
- Actions: In actions, the user can either perform edit or delete operations. To edit the table, the user has to click on the Edit To delete a table, the user has to click on the Delete icon.
After adding the monitor, then it will redirect the user to the configured monitor UI and the user will be able to see the configured monitor as shown in the below figure.
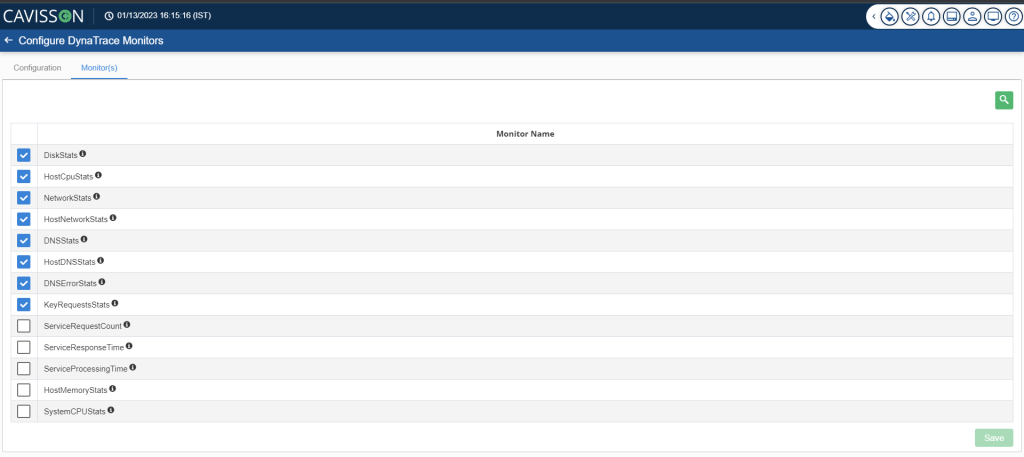
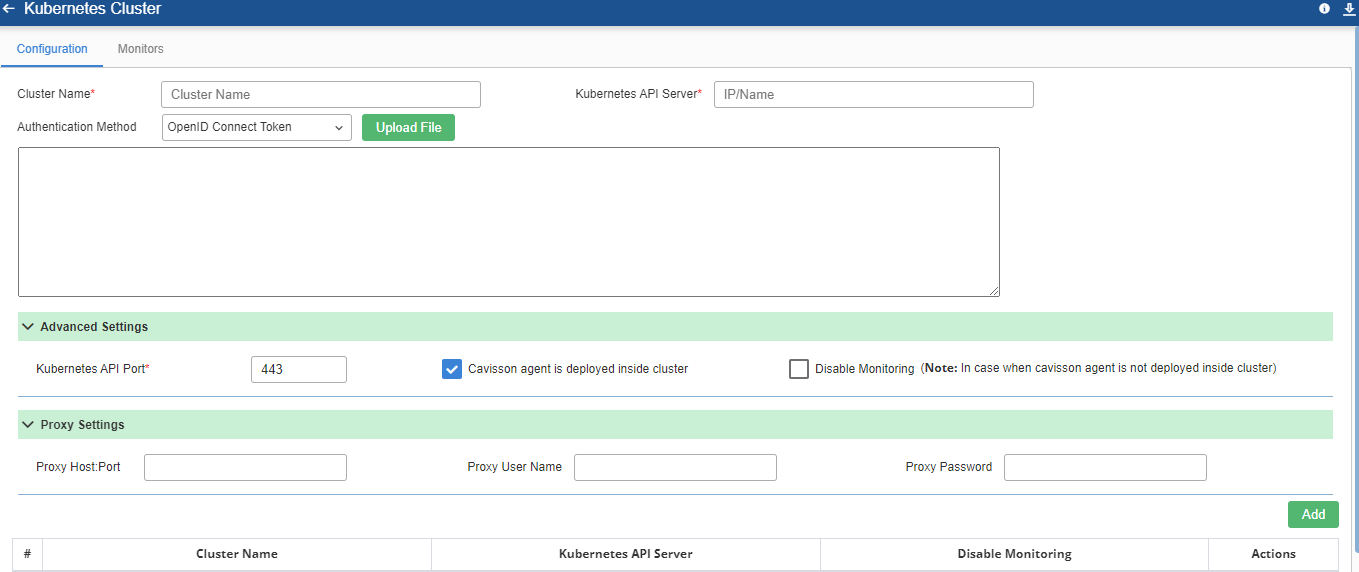
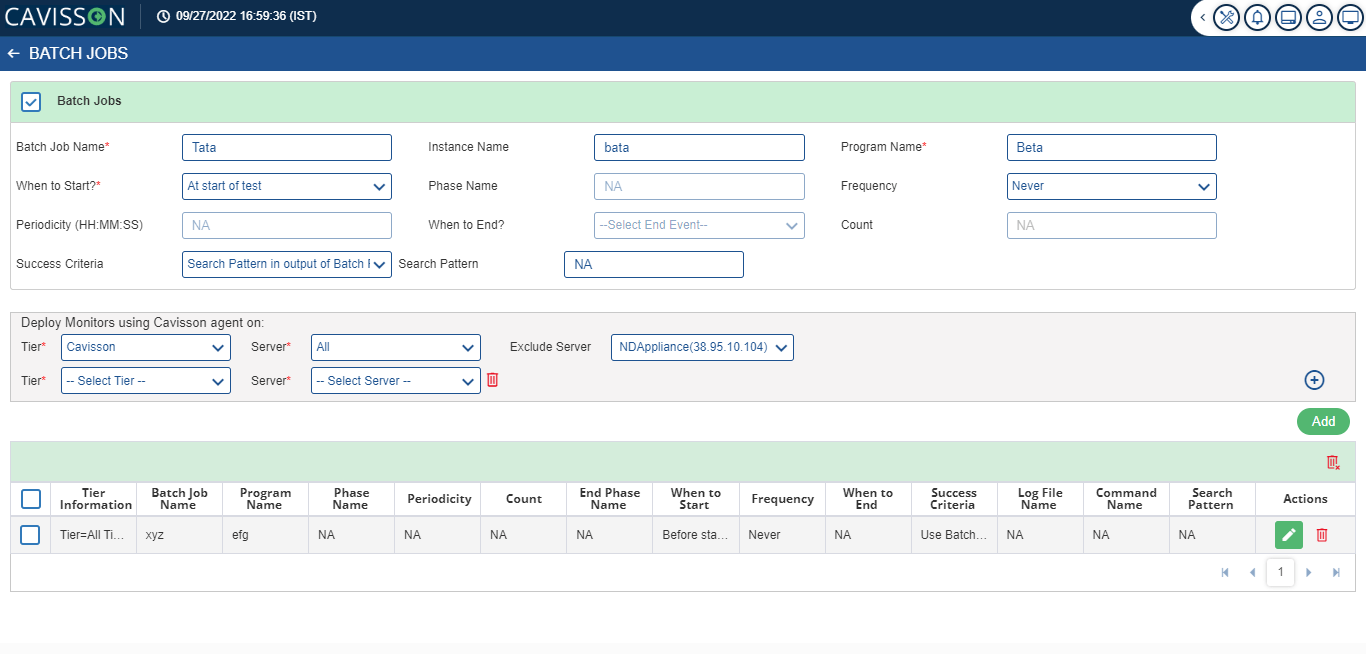
To configure the Kubernetes Cluster Monitors, fill in all the available fields and click Add button on the page. After clicking Add button following details are available in tabular form on the configuration Page.
- Cluster Name
- Kubernetes API Server
- Disable Monitoring
- Actions
If the user clicks the ![]() icon, list of the following monitors is displayed:
icon, list of the following monitors is displayed:
- Kubernetes Node Cpu Memory Stats
- Kubernetes Container Process Stats
- Kubernetes Cluster Stats
- Kubernetes Node Resource Capacity Stats
- Kubernetes Pod Stats Per Name Space
- Kubernetes Pods Stats Per Node
- Kubernetes Container File System Stats
- Kubernetes Deployment Replica Stats
- Kubernetes Pod Network Stats
- Kubernetes Pod Discovery
- Kubernetes Pod Discovery
- Kubernetes Container CPU Stats
- Kubernetes Auto Scale Config Stats
- Kubernetes Services Stats
- Kubernetes Service Status
- Kubernetes Cron Job Stats
- Kubernetes Node CPU Stats
- Kubernetes Node Memory Stats
- Kubernetes Node Block Io Stats
- Kubernetes Container Stats
- Kubernetes Node Device Stats
- Kubernetes Process Stats
- Kubernetes Node Network Stats
- Kubernetes Pod Memory Stats
- Kubernetes Resource Quota Stats Per Name Space
- Kubernetes Daemonset Stats
- Kubernetes Deployment Rolling Update Stats
- Kubernetes Persistent Volume Claim Stats
- Kubernetes Replication Controller Stats
- Kubernetes Pod Volume Stats
- Kubernetes Pod State Stats
- Kubernetes Container State Stats
- Kubernetes Node Usage Stats
- Kubernetes Limit Range Stats
- Kubernetes Replica Set Stats
- Kubernetes CPU Memory Container Stats
- Kubernetes Container Cpu Stats
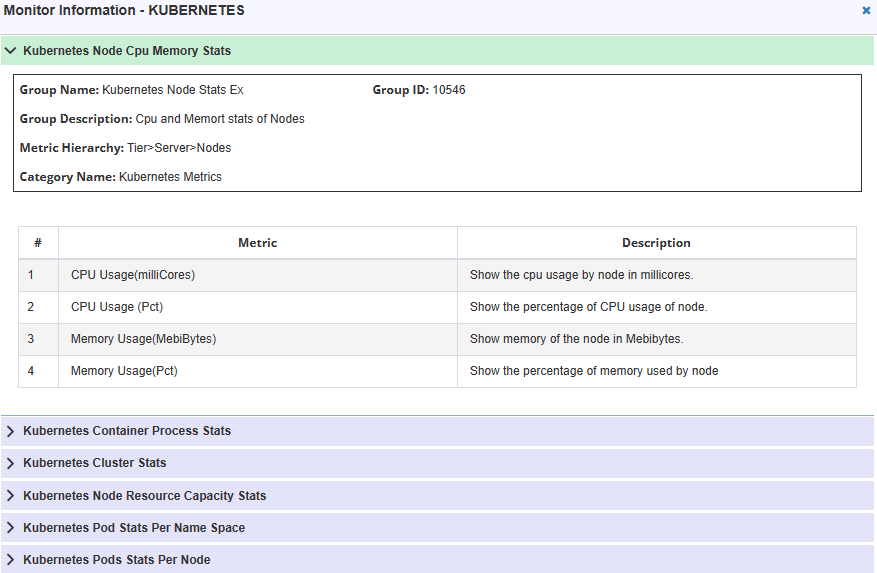
If the user clicks button on any of the monitors, it expands and shows the metrics and their description as shown in the above figure.
If you click the ![]() icon, it helps in downloading the configuration.
icon, it helps in downloading the configuration.![]()
Custom Monitor(s)
Custom monitors are used for grouping monitoring metrics that are relevant in one single dashboard. They are used for showing the data points, graphs, and specific metrics which are important for an application.
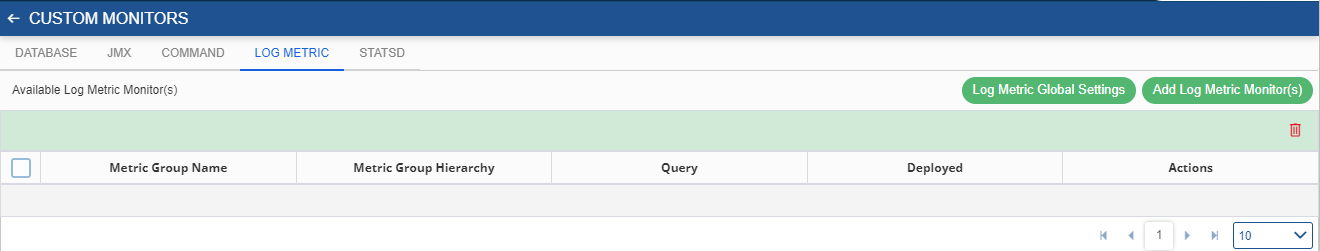
Log Metric Monitor
This monitor is used to configure NetForest monitors. ND agent calls NF REST APIs to get the data and this data is stored in RTG. This monitor is always applied on ND appliances, that is, even if you enable this monitor for any tier, CMON of ND appliances is used to get data from NF. This is done as CMON of different tiers might not have connectivity with NF.
To access this monitor, select Log Metric Monitor from the ‘Custom Monitor(s)’ as shown in the below figure.